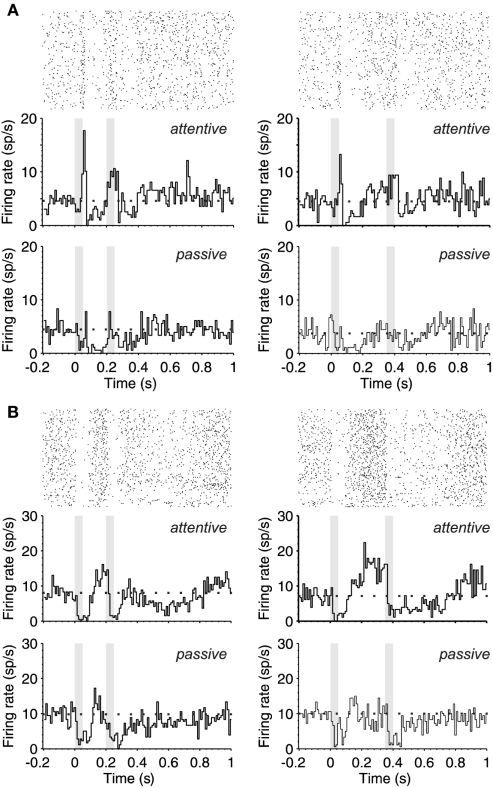
Figure 2.
Ramping-up activity during the interstimulus interval. (A) Upper part. PSTH (180 trials) of the response (bottom) and raster plot (top) of a single neuron during the attentive task shows the response pattern to two identical stimuli (50 ms; 80 dB; 5322 Hz) separated by 150 ms (left) and 300 ms (right). The gray boxes correspond to the periods of auditory stimulation. The PSTH shows an offset response to stimulus 1 and onset response during stimulus 2 while in the passive brain state (lower part) there is an overall decrease of excitability and no monotonic increase of spontaneous activity toward S2 presentation. (B) Same as in (A), but this other neuron is silenced by the auditory stimulation followed by an increase of firing until S2 occurrence (upper part), while in the passive brain state (lower part) the neuronal firing is markedly reduced. In (A,B) the mean spontaneous activity is represented with a dotted line.

