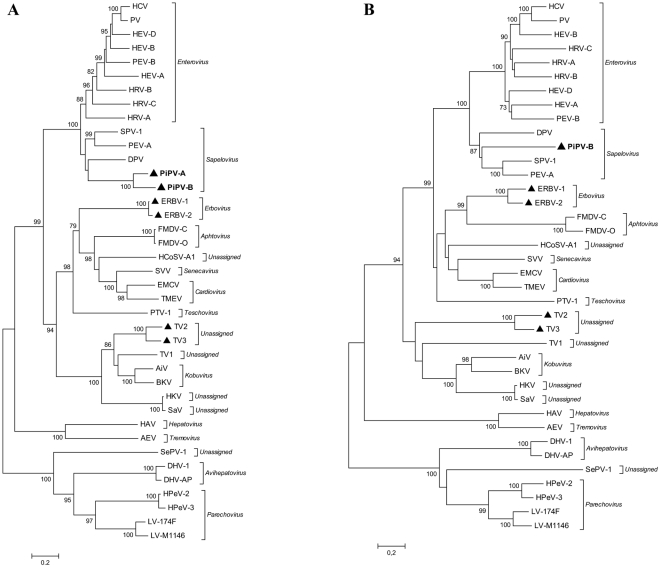
Figure 1. Phylogenetic analysis of A) the complete polymerase protein (3D) and B) the complete P1 capsid region of the picornavirus family.
The trees were constructed by the neighbour-joining method using the Jones-Taylor-Thornton matrix-based model of amino acid substitution. Bootstrap values (>70%) from 1000 replicates are shown. Both trees are plotted to the same scale. The novel isolates are indicated by bold lettering. The viruses marked with ▴ harbour s2m.

