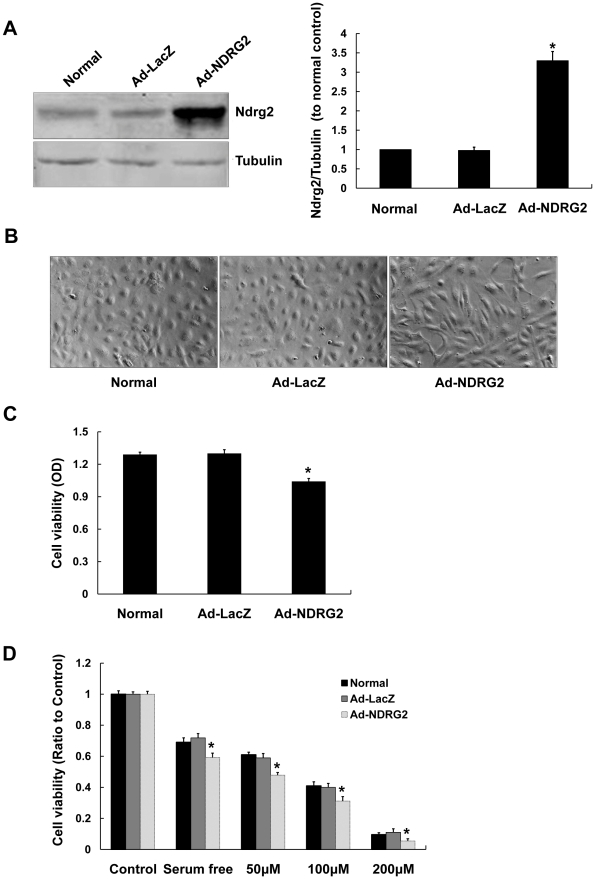
Figure 2. Functional changes of SRA01/04 cells infected with Ad-NDRG2.
A. Shows by Western blot that protein expression of Ndrg2 in SRA01/04 cells is induced when cells are infected with Ad-NDRG2 but not Ad-LacZ (Mean± SD; n = 3. * P<0.05 compare with normal SRA01/04 cells). B. Shows that SRA01/04 cells infected with Ad-NDRG2 after 48 h show morphological changes that include fibroblast-like appearances (100×). C. Shows that cell viability in SRA01/04 cells decreased when infected for 48 h with Ad-NDRG2, but not Ad-LacZ. Determined by the MTT assay (Mean± SD; n = 5. * P<0.05). D. Shows cell viability (normalized to control cells) of uninfected and 48-hour infected SRA01/04 cells as determined by the MTT assay. These results suggest that SRA01/04 cells were more susceptible to oxidative stress after Ad-NDRG2 infection (Mean± SD; n = 5. * P<0.05 compare with uninfected and Ad-LacZ infected SRA01/04 cells).

