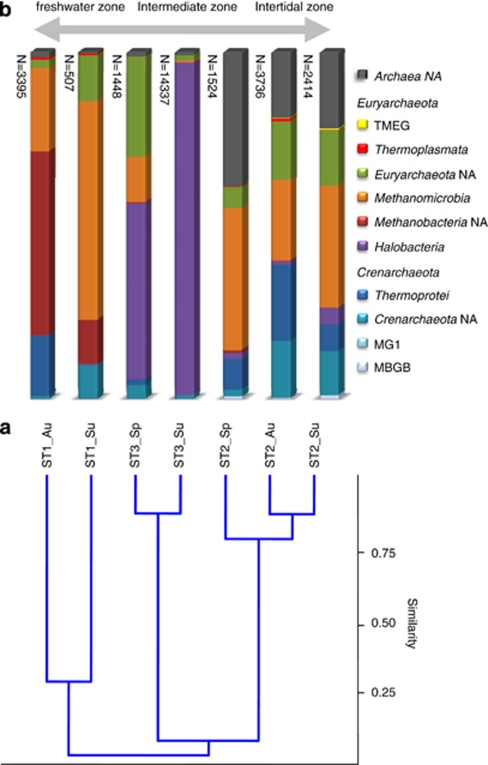
Figure 3.
Comparison of archaeal diversity between the different sampling points. (a) Cluster analysis of archaeal diversity at the class level using a correlation algorithm (the complement 1-r of Pearson's r correlation across the variables). (b) Stacked column graph representing the relative distribution of the dominant classes in the different stations. The total number of sequence reads per sample is given left of the columns. A distinction is made between the Crenarchaeota (shades of blue), the Euryarchaeota (purple to yellow) and the non-assigned (NA) Archaea (dark gray). The double-headed arrow on top indicates the extant conditions with respect to salinity. Sample codes consist of the sampling station and the time point of sampling (Au, autumn; Sp, spring; Su, summer).

