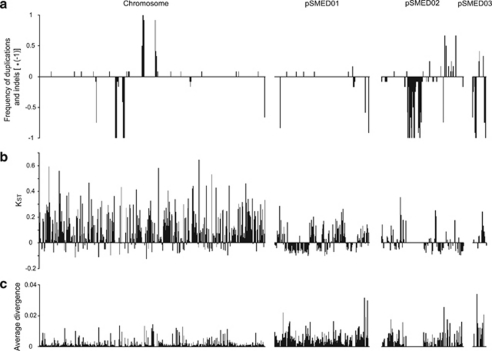
Figure 2.
Distribution of various diversity statistics along the genome in the observed population of S. medicae. (a) Positive values show the frequencies of strains harbouring duplication for a given window when compared with S. medicae WSM 419, while negative values illustrate the frequencies of strains harbouring a deletion. (b) KST values that illustrate the differentiation between the population we sampled and the reference strain S. medicae WSM 419 for the windows showing neither duplication nor deletion events. (c) The average divergence among the strains we sampled is illustrated by bars for the windows showing neither duplication nor deletion events. Statistics are computed for 10 kb windows on the chromosome, pSMED01, pSMED02 and pSMED03. Graphs are drawn to scale.

