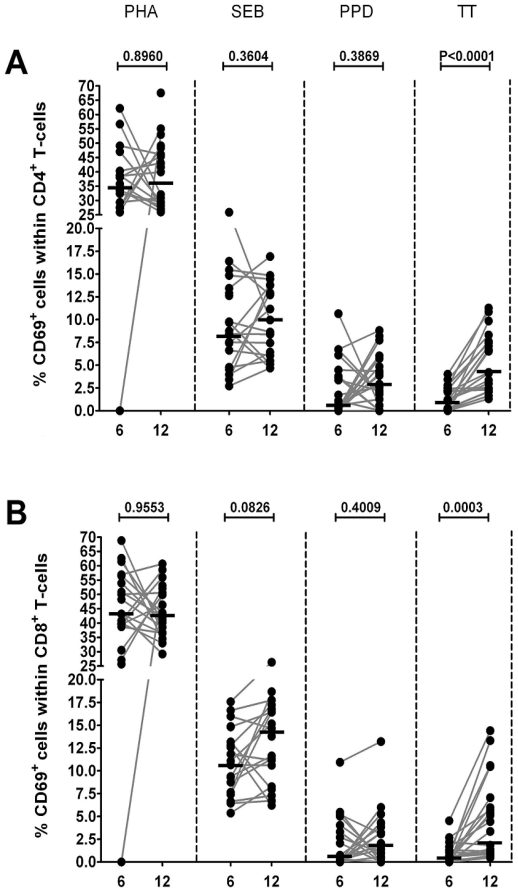
Figure 2. Percentages of CD69 expressing T-cells upon in vitro stimulation.
Frequency of responding CD69+ T-cells, among CD4+ T-cells (A) and CD8+ T-cells (B), in peripheral blood samples from infants (n = 20) at 6 and 12 months of age after in vitro stimulation with PHA, SEB, PPD and TT. Horizontal lines represent the median percentage. The p-values were calculated using the Wilcoxon signed ranks test for paired values.

