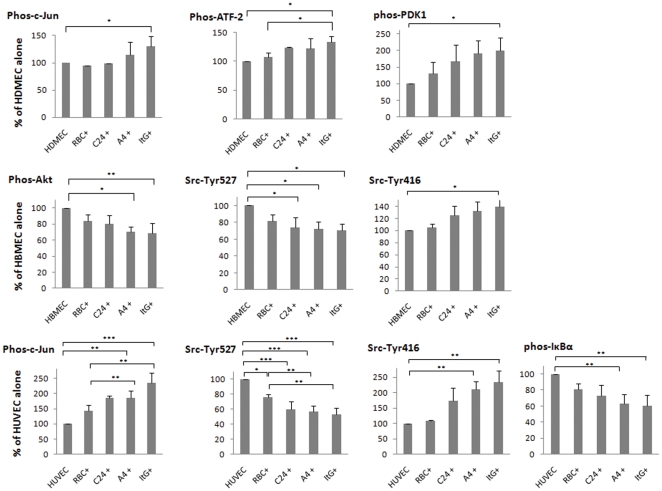
Figure 5. Signalling pathways showing significant changes due to co-culture with IE of parasite lines with different adhesive properties.
Endothelial cells were co-cultured with IE for 20 min, then the activation of signalling components were measured by Western blot and quantitated by intensity scan. Statistical analysis was carried out on three independent experiments. The results are represented as a ratio to the constitutive signalling level seen in the corresponding EC alone sample. Data shown are the means of % response compared to control (EC alone) ± S.D. *P<0.05; **P<0.001; ***P<0.0001.

