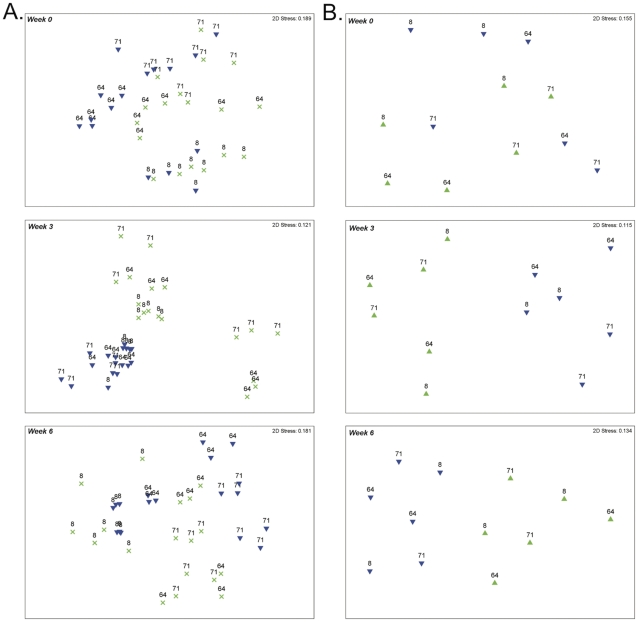
Figure 1. NMDS plots of 16S rDNA and scaC T-RFLP analyses.
Plots are generated from the restriction enzymes with the most consistently significant p-values (MspI for 16S (A) and RsaI for ScaC (B)). Weeks are indicated at top left of each panel. Numerical representations indicate bovine number (8, 64, or 71) and symbols indicate either fiber-adherent fraction (green ×) or liquid fraction (blue ▾).

