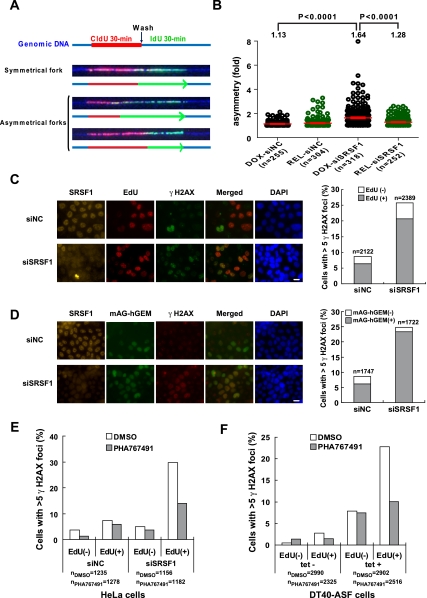
Figure 6.
Depletion of SRSF1 induces replication-dependent DSBs in HeLa cells. (A) Representative images of DNA fibers carrying ongoing replication forks. A schematic representation of the DNA fibers (blue) and replication tracks (CldU in red and IdU in green) is shown below each fiber. Arrowheads indicate the direction of fork progression. (B) Distributions of fork asymmetry are shown graphically. Only nontruncated forks, as determined by DNA counterstaining (blue), were recorded. Forks in dox-treated cells are represented by black circles and those in dox-released cells are represented by green circles. Horizontal red lines represent the mean values of fork AFs with the standard error of the mean (SEM). Means, P-values, and the number of fibers for each sample are indicated. (C) γ-H2AX foci induced by SRSF1 depletion form predominantly in S phase. HeLa cells were transfected with control siRNA (siNC) or SRSF1 siRNA (siSRSF1), respectively. At 48 h after siRNA transfections, cells were pulse-labeled with 10 μM EdU for 30 min and analyzed by indirect immunofluorescence analysis with antibodies against SRSF1 (orange), EdU (red), and γ-H2AX (green). Representative images are shown in the left panel. Bar, 10 μm. The percentage of γ-H2AX foci-positive cells (whole bar) and the percentage of γ-H2AX foci-positive cells in the EdU-labeled population (hatched section) are shown in the right panel. The number of cells for each sample is indicated. (D) SRSF1 depletion did not exacerbate γ-H2AX foci formation in the cells in G1 phase. mAG-hGEM cells were transfected with siNC or siSRSF1. At 48 h after siRNA transfection, cells were fixed and subjected to indirect immunofluorescence analysis with antibodies against SRSF1 (orange) and γ-H2AX (red). Cells containing mAG-hGEM protein showed fluorescent green. Representative images are presented in the left panel. Bar, 10 μm. The percentage of γ-H2AX foci-positive cells (whole bar) and the percentage of γ-H2AX foci-positive cells in the mAG-hGEM-positive population (hatched section) are shown in the right panel. The number of cells for each sample is indicated. (E) HeLa cells were transfected with siNC or siSRSF1, respectively. At 48 h after transfection, cells were treated with DMSO or 5 μM PHA767491 for 6 h before harvest. Cells were then pulse-labeled with 10 μM EdU for 30 min and analyzed by indirect immunofluorescence analysis with antibodies against SRSF1, EdU, and γ-H2AX. The percentage of γ-H2AX foci-positive cells is shown graphically. The number of cells for each sample is indicated. (F) DT40-ASF cells were grown in the presence or absence of 1 μg/mL tet for 40 h and subjected to a 4-h treatment with DMSO or 5 μM PHA767491. Cells were analyzed as described in E. The percentage of γ-H2AX foci-positive cells is shown graphically. The number of cells for each sample is indicated.

