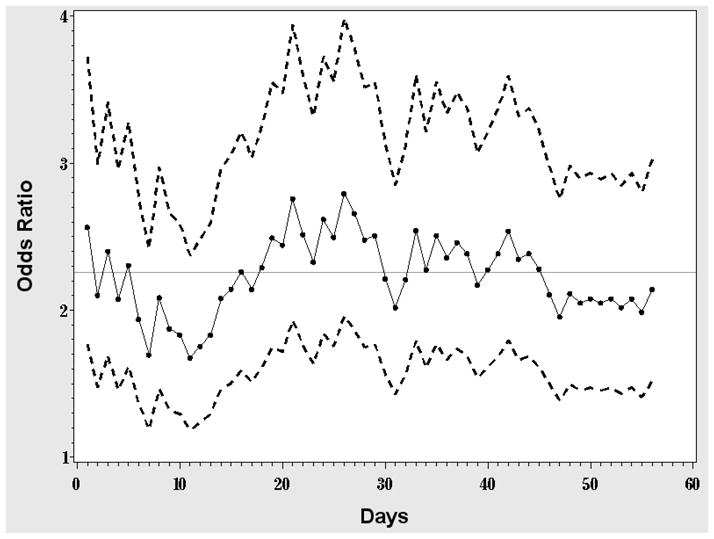
Figure 1.

Daily OR of the drug effect. Each dot represents the estimated OR from a simple logistic regression of the smoking status data from day j with only drug in the model. Points are connected by a solid line to illustrate the trend over time; dashed lines represent the corresponding 95% CIs. The horizontal line represents the estimated OR from the corresponding GEE exchangeable model.
