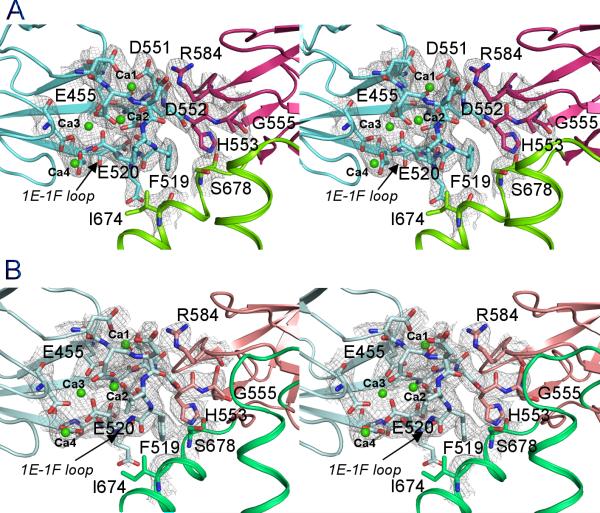
Figure 3.
Stereo views of the domain interface between CBD1 and CBD2. A. CALX 1.1; B. CALX 1.2. CBD1, CBD2 or 2F-2G loop are depicted as cartoon in blue, red or green. The residues on the domain interface are shown as stick-balls. Four Ca2+ ions (Ca1-Ca4) are drawn as green spheres. The electron density maps contoured at 1.5σ are drawn as grey meshes. See also Figure S1.

