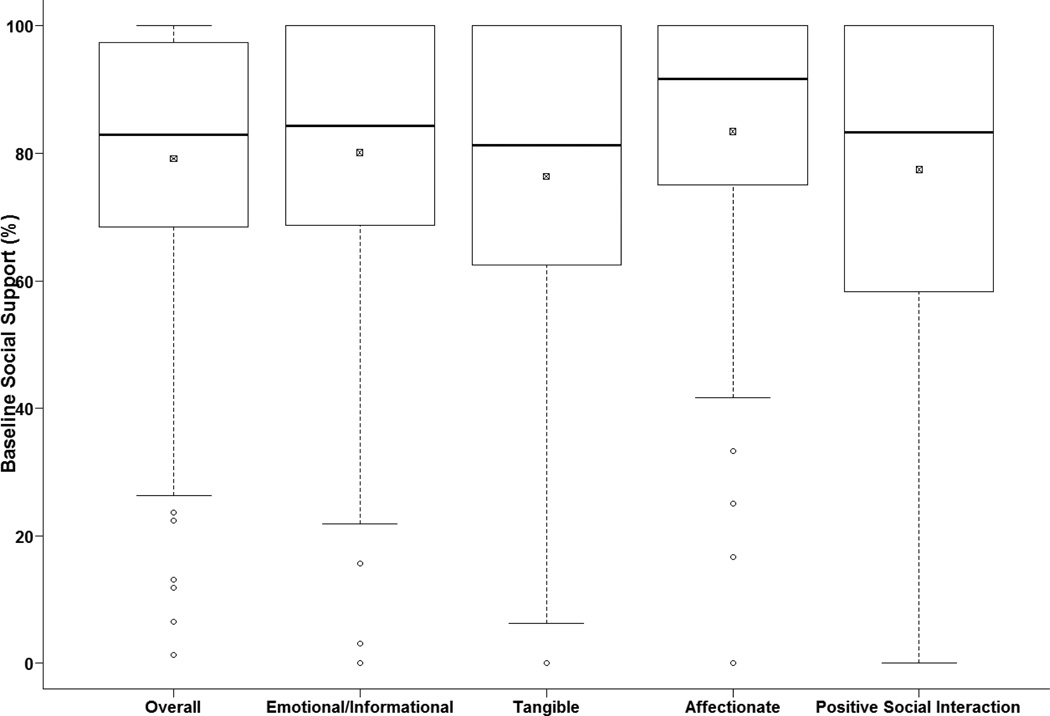
Fig. 1.
Box and whisker plot displaying the distribution of the baseline (N=394) overall social support scores and the four social support subscales. Median is represented by the dark line. The box is representative of the interquartile range (IQR), and the small box with the × represents the mean. Data points outside of the whiskers are considered outliers. The median (IQR) for the fives scores were as follows: Overall: 82.9 (68.4–97.0); Emotional/Informational: 84.4 (68.8–100); Tangible: 81.3 (62.5–100); Affectionate: 91.7 (75–100); Positive Social Interaction: 83.3 (58.3–100). The data are slightly negatively skewed. Most participants (73%) reported baseline social support scores that were relatively high compared to normative samples

