Fig. 2.
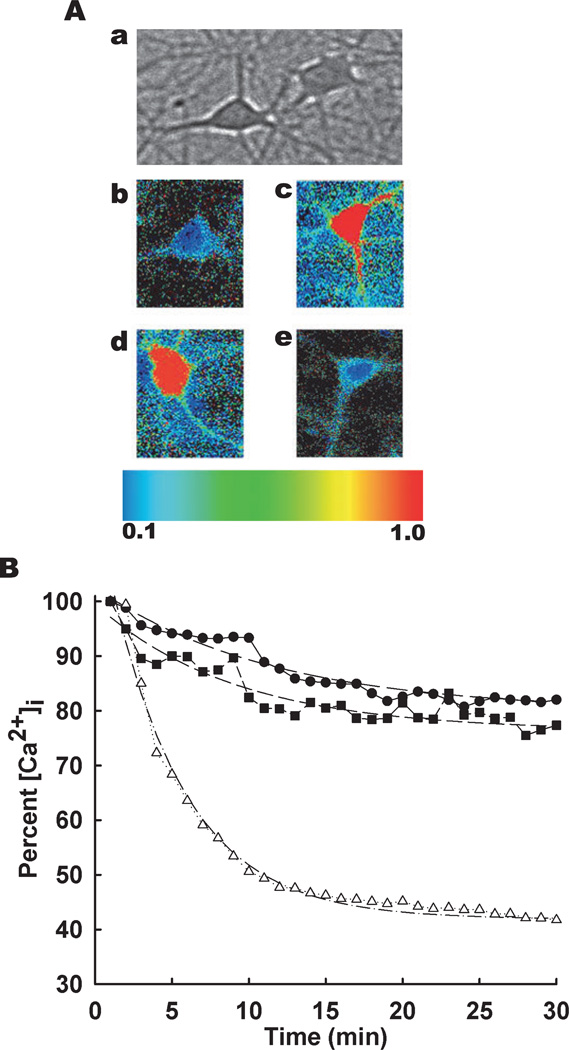
Dantrolene lowers [Ca2+]i to baseline levels following in vitro SE. (A) Pseudocolor ratiometric images of representative neurons in culture. (a) Phase bright reference image depicting typical pyramidal-shaped hippocampal neurons that lay above the focal plane of glia. (b–e) Representative ratiometric (340 / 380) images of neurons from control (b), low Mg2+ (c), MK-801 (d) and dantrolene (e) treated cultures. All the ratiometric images are at the 30-min time point following respective treatments. (B) Following 3 h of in vitro SE (time = 0), cells were treated with vehicle (0.1% DMSO, ●), MK 801 (10 µm, ■) or dantrolene (50 µm, Δ). 340 / 380 ratios were recorded every 30 s for 30 min and normalized to percentage of the peak ratio observed at time = 0. Dotted lines represent data fitted using exponential decay function [y = a*exp(b / (x+c))] using parameter estimates reported in Table 1. n = 6 plates per treatment group with ~60 neurons imaged per condition.

