Figure 2.

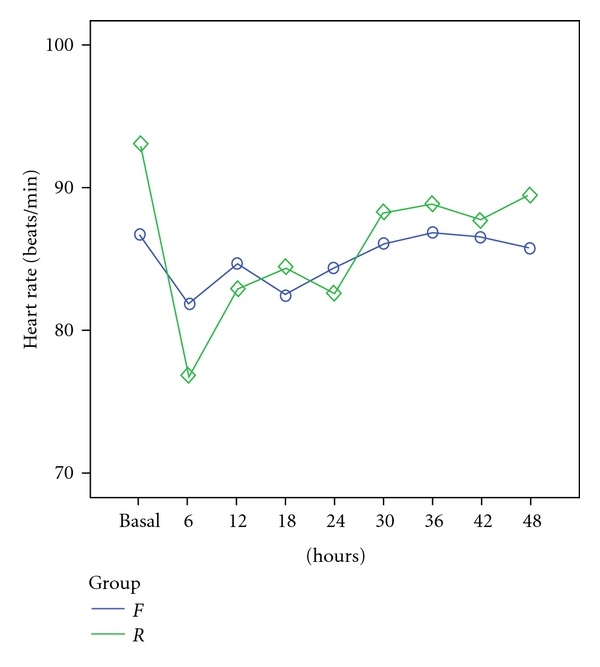
Mean heart rate (beats/min) in F and R groups before induction (basal) and during the first 48 hours of the sedation and analgesia therapy (P > 0.05).

Mean heart rate (beats/min) in F and R groups before induction (basal) and during the first 48 hours of the sedation and analgesia therapy (P > 0.05).