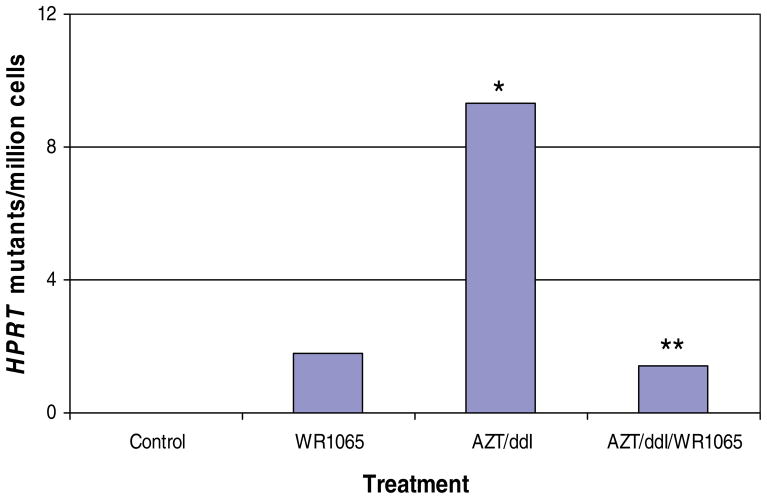
Fig. 1.
Comparison of the induced mutant frequency at the HPRT locus of human TK6 lymphoblastoid cells exposed for 3 days to vehicle alone, 150 μM WR1065, 100 μM AZT-ddI (equimolar), or 100 μM AZT-ddI (equimolar) plus 150 μM WR1065. Drug-induced mutant frequencies were determined by subtracting the mean mutant frequency measured in the vehicle-exposed group (mutant frequency = 2.8 × 10⁻⁶) from the mean observed mutant frequency measured in individual treatment groups. An asterisk (*) designates that the mean observed mutant frequency in AZT-ddI-exposed cells was significantly increased over the mean (vehicle-exposed) control cell value (P < 0.05), whereas the double asterisk (**) indicates that the mean observed mutant frequency in cells exposed to AZT-ddI plus WR1065 was significantly reduced compared with cells exposed to AZT-ddI only (P < 0.05) but was not significantly different from the mean observed value for vehicle-exposed cells. WR1065 reduced the mutagenic effects of AZT-ddI by at least 85%. [Color figure can be viewed in the online issue, which is available at www.interscience.wiley.com.]

