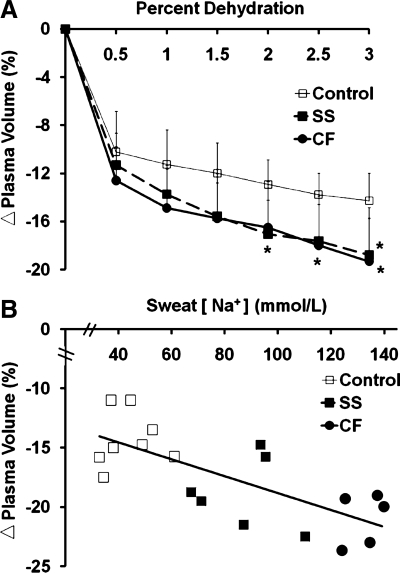
Fig. 2.
A: percent change (Δ) in plasma volume from baseline with percent dehydration (%body wt loss) via exercise in the heat was significantly affected by group (P = 0.05), with a greater drop observed for CF subjects and non-CF SS than Controls. B: scatter plot indicating relationship (r = 0.53, P = 0.02) between individual subjects' relative change in plasma volume observed at 3% dehydration and regional sweat [Na+]. *Less than Control, P ≤ 0.05.

