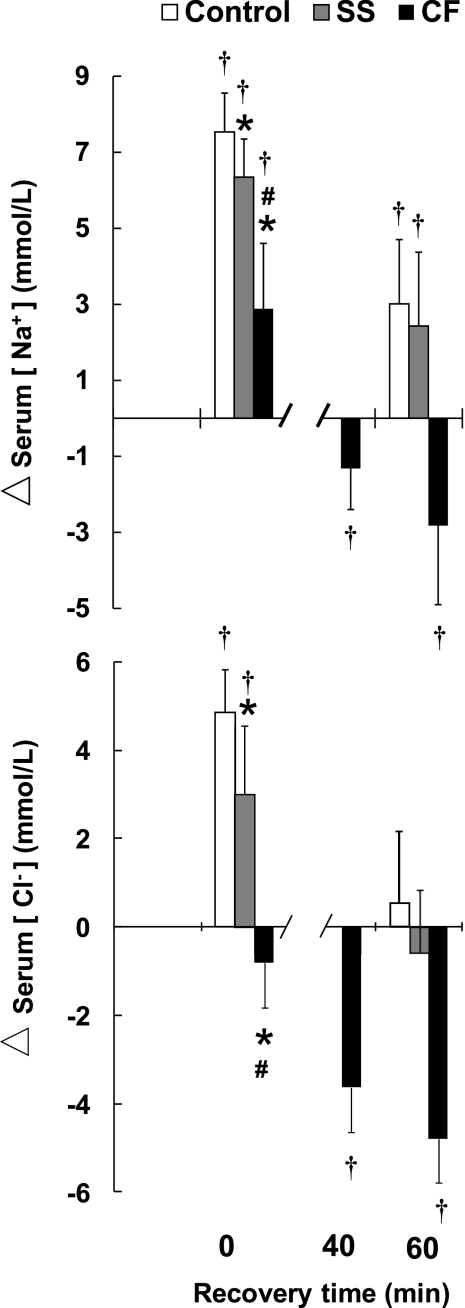
Fig. 6.
Mean ± SD change (Δ) relative to baseline in serum [Na+] and serum Cl− concentration ([Cl−]) after 3% dehydration (time point 0), with ad libitum fluid ingestion during recovery for Control, non-CF SS, and CF subjects. At 40 min postexercise, an additional blood sampling was performed for CF followed by provision of ad libitum salty foods (see text). Between-group statistical comparisons after the 40-min time point do not include CF. *Significantly less than Control, P < 0.01 for CF and P = 0.05 for SS. #CF significantly less than SS, P < 0.01. †Significant change from baseline, P < 0.05.

