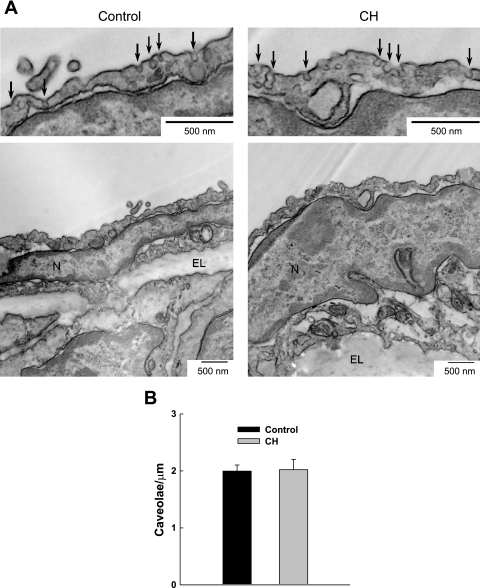
Fig. 9.
Transmission electron microscopy was used to determine the number of caveolae in the endothelium of pulmonary arteries from control and CH rats. A: representative electron micrographs at low and high magnification of caveolae (denoted by arrows) in arteries from control (left) and CH (right) rats. N, nucleus; EL, elastic lamina. B: caveolar density is expressed as the number of caveolae per micrometer length of membrane (n = 3 rats/group). There were no significant differences.

