Fig. 3.
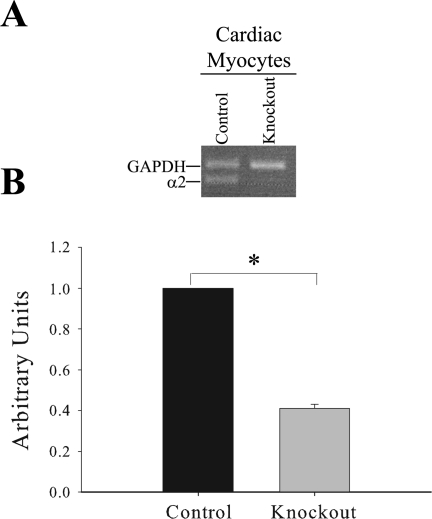
mRNA expression of the α2 isoform of the Na,K-ATPase in isolated cardiac myocytes. A: representative qualitative PCR gel from isolated cardiac myocytes using the real-time α2 and GAPDH primers. B: quantitative real-time PCR analysis of mRNA expression of α2 in isolated cardiac myocytes normalized to GAPDH expression. Data represent an arbitrary ratio of mRNA expression of α2 in knockout mice to that expressed in control mice from two independent experiments. Bars represent means ± SE; n = 3. *P = 0.002, statistical difference.

