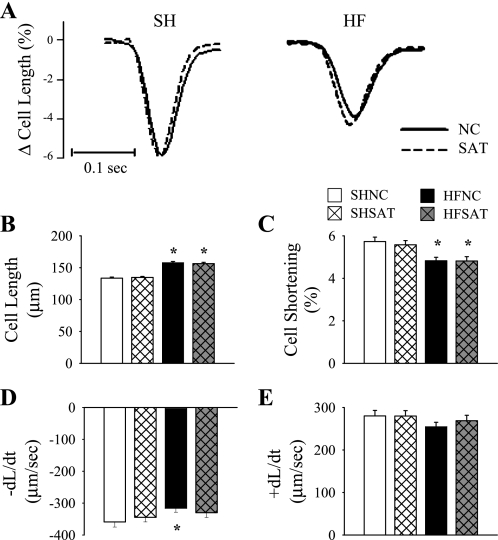
Fig. 2.
LV cardiomyocyte shortening. A: representative tracings of cell shortening at 1 Hz averaged from 8 peaks from the same cell from each group. B–E: cell length (B), percent cell shortening (C), and velocity of cell shortening (−dL/dt; D) and velocity of relaxation (+dL/dt; E) were measured on fresh isolated LV cardiomyocytes at 1 Hz. n = 117–137. *P < 0.05 HF vs. SH groups within diet.

