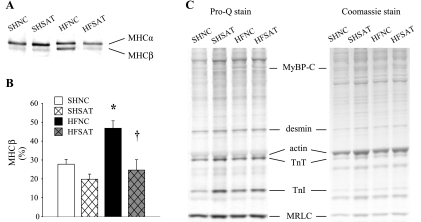
Fig. 6.
Myofilament protein composition and phosphorylation. A: representative bands of myosin heavy chain (MHC) α- and β-isoforms from the same gel. Protein expression was quantified using electrophoresis followed by silver staining. B: MHC-β expressed as a percentage of total MHC. n = 5. C: representative Pro-Q- and Coomassie blue-stained gels. TnT, troponin T; TnI, troponin I. *P < 0.05, HF vs. SH groups within diet; †P < 0.05, diet effect within HF groups.

