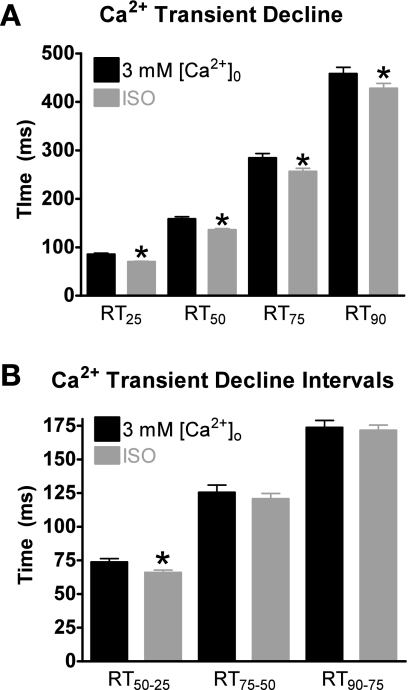
Fig. 3.
Effects of 3 mM [Ca2+]o and ISO on Ca2+ transient decline with matched peaks. A: pooled data (means ± SE) of Ca2+ decline with 3 mM [Ca2+]o (black) or ISO (gray). RT25, RT75, and RT90, the time it takes the Ca2+ transient to decline by 25, 75, and 90%, respectively, from its peak amplitude. B: pooled data (means ± SE) of Ca2+ transient decline time intervals with 3 mM [Ca2+]o or ISO. RT50-25, the time for Ca2+ to decline 25% from the peak amplitude to the 50% point; RT75-50, the time for Ca2+ to decline 50% from the peak amplitude to the 75% point; RT90-75, the time for Ca2+ to decline 75% from the peak amplitude to the 90% point. *P < 0.05 vs. corresponding 3 mM [Ca2+]o (n = 21 cells/10 hearts).

