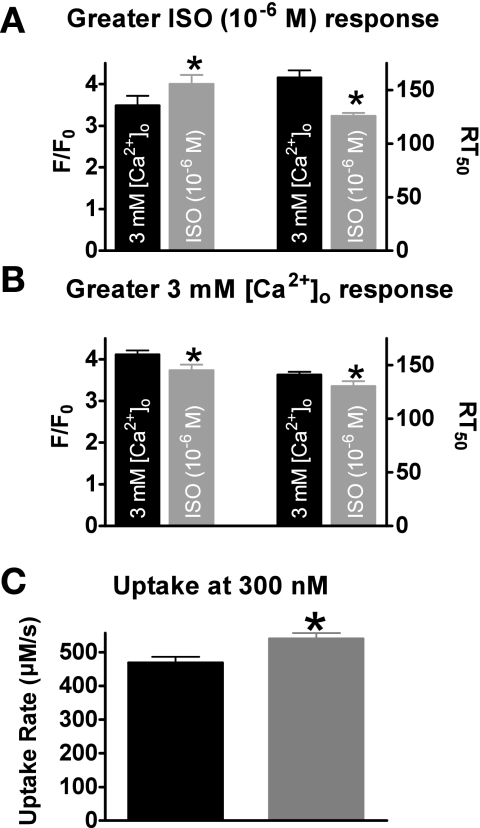
Fig. 5.
Grouped Ca2+ transient amplitudes and declines. A: pooled data (means ± SE) of Ca2+ transient amplitude (left) and decline (right) in myocytes that had a higher response to ISO (n = 14). B: pooled data (means ± SE) of Ca2+ transient amplitude (left) and decline (right) in myocytes that had a higher response to 3 mM [Ca2+]o (n = 7). C: pooled data (means ± SE) of calculated Ca2+ uptake rate at 300 nM [Ca2+]i (*P < 0.05) vs. corresponding 3 mM [Ca2+]o (n = 21 cells/10 hearts).

