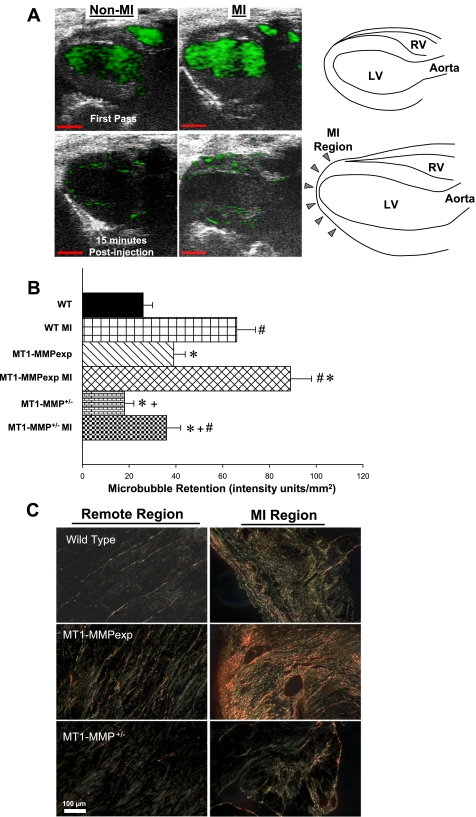
Fig. 2.
A: representative in vivo localization of MT1-MMP (40 MHz, 30 μm resolution) in a WT mouse without MI and in a WT mouse at 14 days post-MI. Images were obtained immediately following injection (First Pass) and at 15 min following tail vein injection of MT1-MMP antibody-conjugated echodense microbubbles (3 μm diameter, 3.6 × 10⁷ microbubbles). Contrast retention at 15 min (green) was quantified. Schematics for orientation of these contrast echocardiograms are shown on the far right (scale = 2 mm). B: MT1-MMP-targeted contrast microbubble binding was quantified as contrast intensity within a region of interest (ROI) within the viable myocardium remote from the MI zone. Results were normalized by dividing the total intensity measured within each ROI by the area of the ROI. Values were computed for each non-MI group (n = 3/group) and post-MI groups (n = 5/group). In the viable myocardial region, microbubble retention was higher than respective non-MI values in all MI groups but was highest in the MT1-MMPexp group and lowest in the MT1-MMP+/− group. C: LV sections taken from the MI region and the remote region (septal wall) were stained with picro-sirius red and imaged under polarized light in WT mice (n = 5), MT1-MMPexp mice (n = 6), and MT1-MMP+/− mice (n = 4). As expected, increased collagen accumulation occurred within the MI region in all groups. However, increased collagen staining was observed in the MT1-MMPexp mice in both the remote and MI regions and appeared reduced in the MT1-MMP+/− mice. A minimum of 6 random fields from each region for each mouse was digitized and analyzed and compared with referent non-MI WT values (n = 5). This analysis is summarized in results (scale = 100 μm). P < 0.05 vs. pre-MI values (#), vs. WT MI values (*), and vs. MT1-MMPexp MI values (+).

