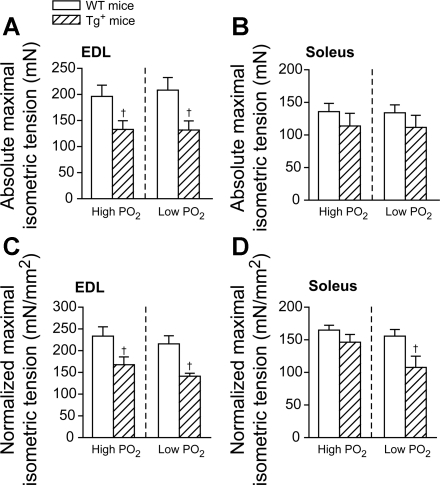
Fig. 2.
Maximal initial isometric tension from EDL (A and C) and soleus (B and D) in both WT (open bars) and Tg+ (crossed bars) mice under different oxygen tensions. Isometric tension is represented by either the absolute tension development (in mN; A and B) or the tension development normalized by the cross-sectional area (in mN/mm2; C and D). †P < 0.05, Tg+ vs. WT under the same Po2 condition, one-way ANOVA. Data were averaged from 9 muscles of 5 mice for WT and 7 muscles of 5 mice for Tg+.

