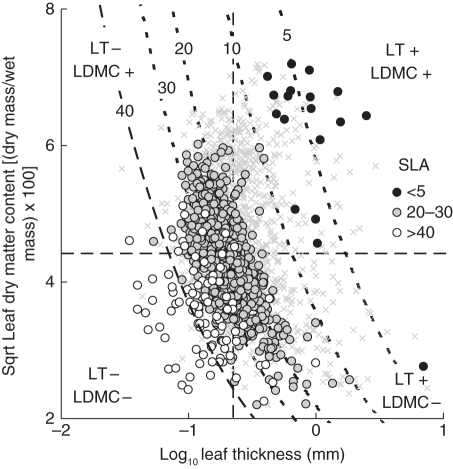
Fig. 1.
A tentative ecological classification of species (×) in relation to LT and LDMC. Median values are used to divide ‘leaf thickness/leaf dry matter content space’ (dashed lines) into quadrants and the position of five labelled ‘SLA contours’ (dotted curves) calculated from eqn (2a). Species groupings of contrasted SLA are superimposed.

