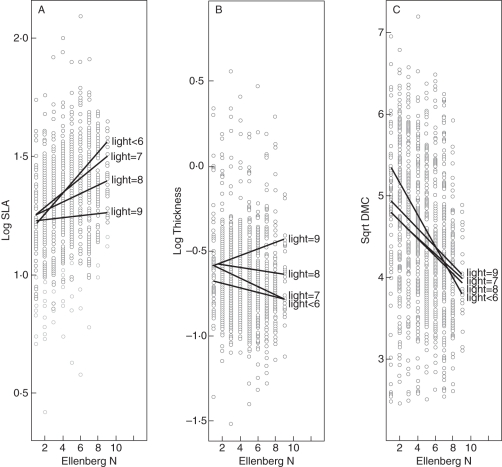
Fig. 2.
Ellenberg ‘Nitrogen Figures’ plotted against (A) SLA, (B) LT and (C) LDMC for 1073 species. Lines show the linear regressions of each dependent variable against Ellenberg N for subsets of species having different Ellenberg ‘Light Figures’. Low Ellenberg figures identify extremely low concentrations of available N and deep shade, respectively, and high values identify N-rich and unshaded conditions.

