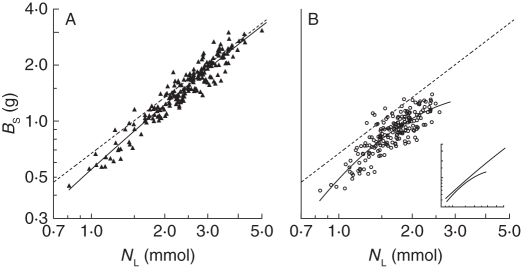
Fig. 1.
Relationships between final shoot biomass (BS) and leaf N pool (NL) of 200 willow genotypes (means of three replicates) grown experimentally in a glasshouse under well-watered (A) and water-stressed (B) conditions. For ease of comparison, the regression lines for the two water regimes are shown in the same figure in the inset. Broken lines indicate slope of 1, i.e. a hypothetically constant leaf N efficiency (g mmol−1) across all genotypes and treatments. Quadratic regressions: (A) loge y = 1·192 loge x – 0·056 (loge x)2 – 0·597, r2 = 0·92, P < 0·001, n = 200; (B) loge y = 1·410 loge x – 0·480 (loge x)2 – 0·715, r2 = 0·71, P < 0·001, n = 200. Note the loge scales.

