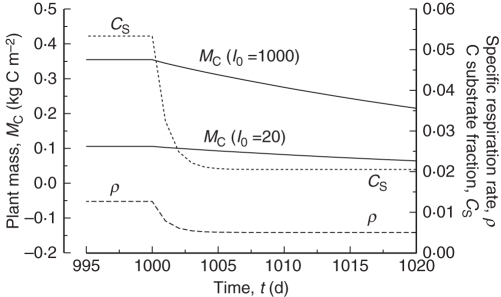
Fig. 7.
Respiration decline in the dark. Plants are grown to a steady state [eqns (36)–(42)] at high and low continuous light [eqns (4)], I0 = 1000, 20 J PAR m−2 s−1 (4600, 92 µmol PAR m−2 s−1). At time t = 1000 d, light is switched off. Plant mass MC is given in eqns (18), specific respiration rate ρ [kg C respired (kg total C)−1 d−1] by eqn (14), and substrate fraction CS [kg substrate C (kg structural C)−1] by eqn (11).

