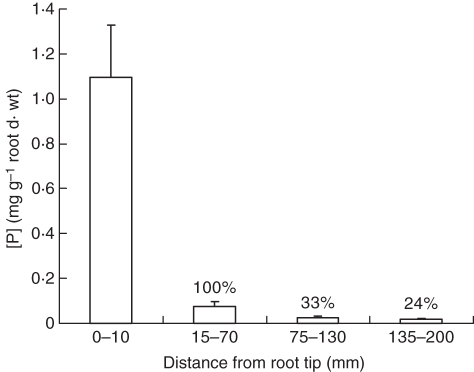
Fig. 10.
Phosphorus concentrations in four regions along roots, from growing tips to a region of complete epidermal and cortical senescence. To better relate change in whole root [P] as this senescence progresses [P] was expressed as a percentage of that in the first region where root elongation is complete, which is set arbitrarily at 100 % (± s.e., n = 7).

