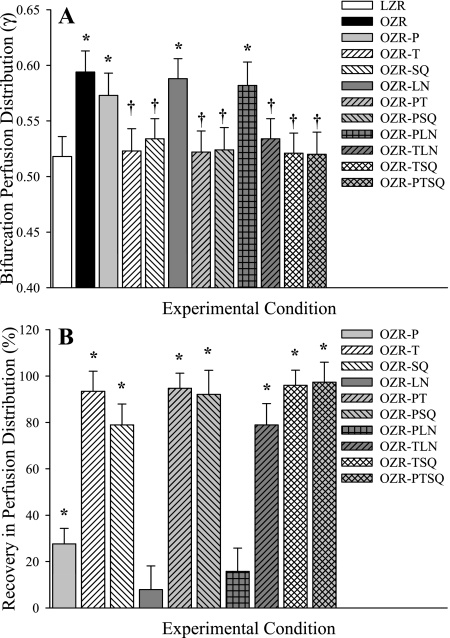
Fig. 4.
Microvascular perfusion distribution (γ) at bifurcations spanning 3A (parent) and 4A (daughter) arterioles within in situ cremaster muscle. Data are presented as means ± SE for LZR under control conditions and in OZR under control conditions and following treatment with the adrenoreceptor antagonist phentolamine (P), the antioxidant TEMPOL (T), the PGH2/TxA2 receptor blocker SQ-29548 (SQ), the nitric oxide synthase inhibitor l-NAME (LN), or combinations of these agents. A: data describing the magnitude of γ at the 3A-4A bifurcation under the specific experimental conditions. B: % recovery (to the level determined in LZR) in γ at that bifurcation as a result of the imposed pharmacological challenge. Please see text for additional detail. A, *P < 0.05 vs. LZR; †P < 0.05 vs. OZR. B, *P < 0.05 vs. no change.

