Figure 3.
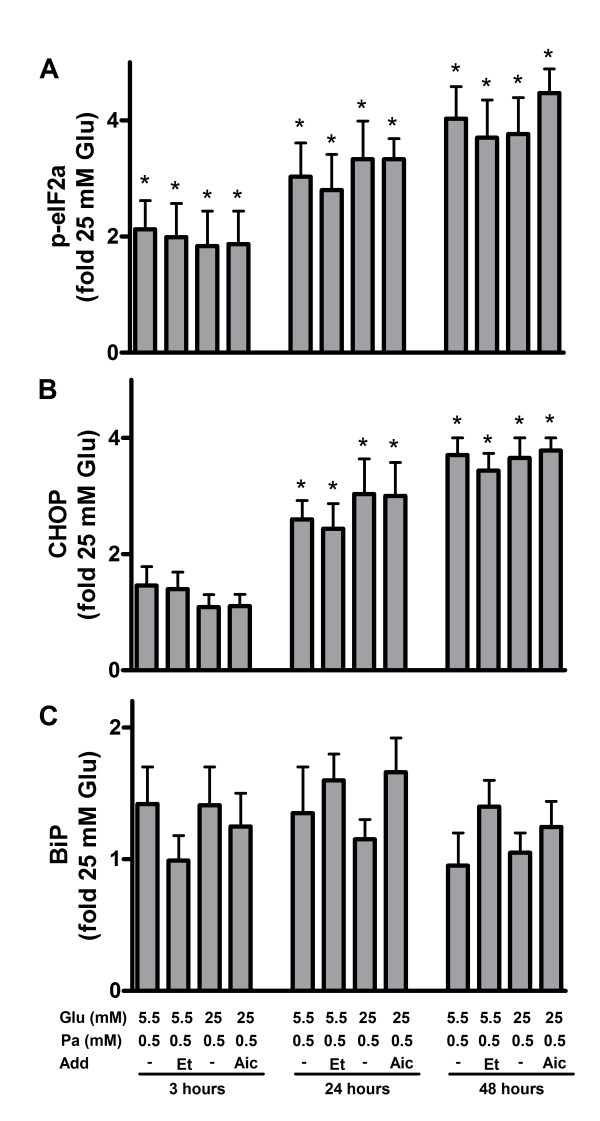
Unfolded protein response in palmitate-exposed MIN6 cells. The cells were cultured for 3, 24 and 48 hours in the presence of 0.5 mM palmitate (Pa) at 5.5 or 25 mM glucose (Glu). AICAR (1 mM, Aic) or etomoxir (0.2 mM, Et) were added as indicated. Cells cultured at 25 mM glucose alone were considered as control. After culture, protein levels of p-eIF2α (A), CHOP (B) and BiP (C) were measured. Protein levels are means ± SEM of 4 independent experiments. *P < 0.05 compared to control.

