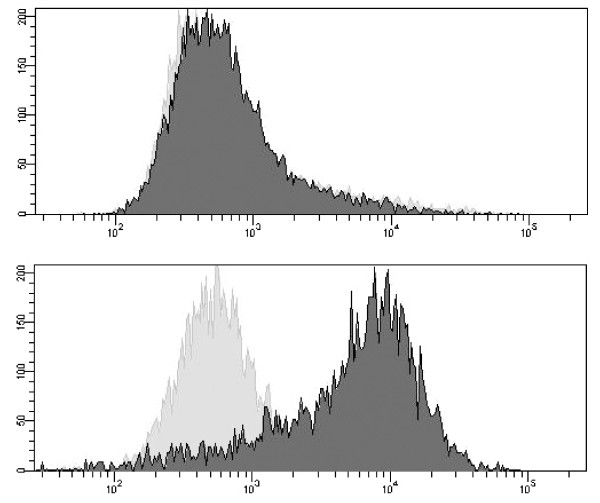
Figure 5.
Analysis of a surface marker on two different cell lines by flow cytometry. Histograms showing unlabelled control cells (solid gray area) and fluorescently labeled cells with a surface marker (solid black area). A) showing a clear positive expression and B) no expression of the surface marker.

