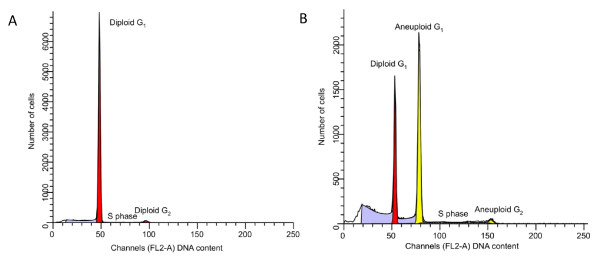
Figure 6.
Comparison of histograms. (A) Histogram from an ovarian diploid cancer: Red population: Flow cytometric DNA index: 1.00, S phase fraction: 1.5%. (B) Histogram from an ovarian non-diploid cancer: Yellow population: Flow cytometric DNA index: 1.47, S phase fraction: 11.9%. Red population corresponds to the contribution of DNA diploid (DNA index: 1.00) cells in the tissue sample.

