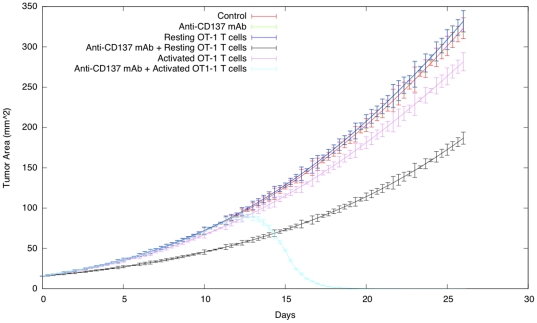
Figure 3. Tumor-area curves of virtual mice receiving OT-1 T cells and anti-CD137 mAb.
B16-OVA cells were injected toward the immediate neighborhood in the center of lattice at timestep 0. Immunotherapy on day 3 with 100 µg of rat IgG (control) or anti-CD137 mAb i.p. were simulated injecting the compound around the lattice walls. Virtual mice that also received in the same day activated or resting OT-1 T cells i.v. were simulated in the same way.

