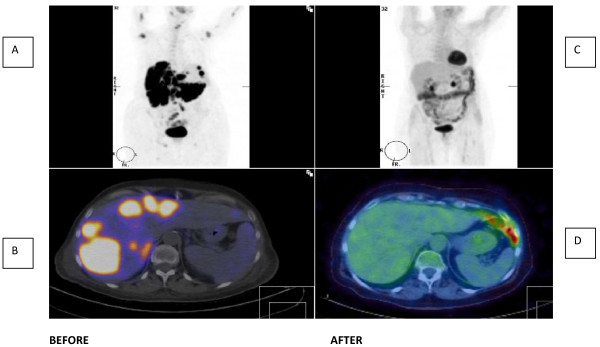
Figure 4.
PET scan imaging before and after six cycles of R-CHOP. (A) PET scan before chemotherapy. Note multiple metabolically active areas in the liver, axillae, neck and base of skull. (B) PET-CT scan before chemotherapy demonstrating widespread metastases in liver. (C) PET scan after chemotherapy; complete resolution of metastases with only physiological appearances in gut. (D) PET-CT scan after chemotherapy showing complete resolution of liver metastases.

