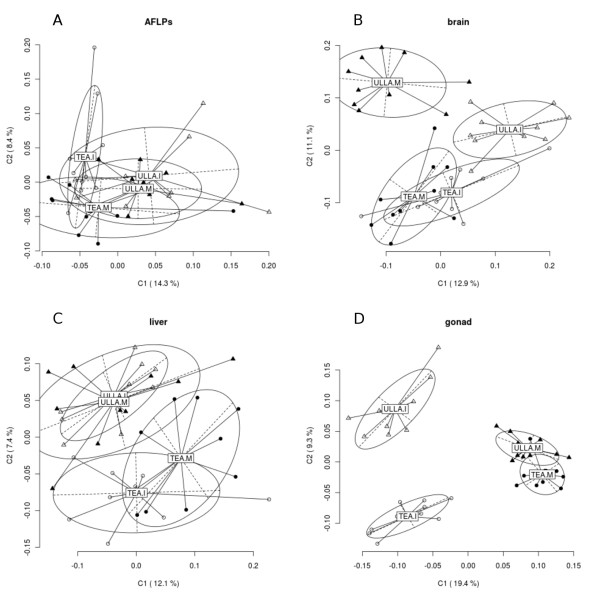
Figure 1.
Principal Coordinates Analysis (PCoA) results for genetic (AFLPs, panel A) and epigenetic (brain, liver and gonad, panel B, C and D respectively) differentiation between rivers and maturity status. The first two coordinates (C1 and C2) are shown with the percentage of variance explained by them between parentheses. Circles represent individuals from Tea river and triangles from Ulla river. Open symbols represent immature individuals while filled symbols represent mature. Population labels show the centroid for the points cloud in each population. Ellipses represent the dispersion of those points around their center. The long axis of the ellipse shows the direction of maximum dispersion and the short axis, the direction of minimum dispersion.

