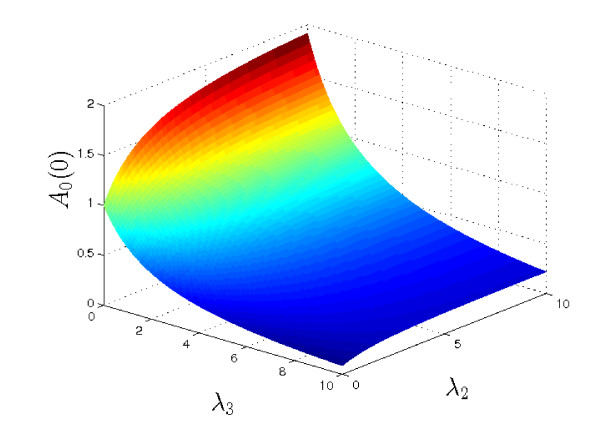
Figure 4.
Plot showing A0(0) (see equation (9a)) for a range of values of λ2 and λ3 (with μA/δA = 1). Note that the largest values of A0(0) are achieved when λ3 = 0 (no removal/consumption of a) and λ2 is large (rapid breakdown of c), in which case AS (0) → 1 + μA/δA = 2. Hence the highest levels of a at the centre of the tissue occur when the rate of complex breakdown (λ2) is rapid, and the rate of consumption of a (λ3) is minimised.

