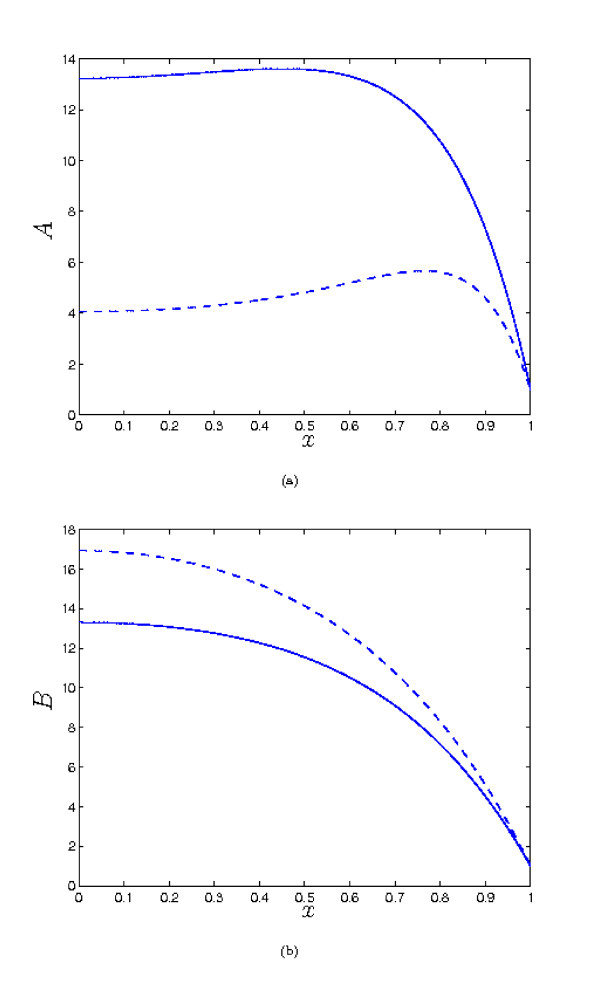
Figure 7.
Plots of the steady state solution for A and B. Parameter values: λ1 = 0 (solid), λ1 = 0.01 (dash). Other parameter values: λ2 = 1 λ3 = λ4 = 0.5, λ5 = 12, μA = 10, μB = 0.2, δA = 0.02, δB = 0.1. In this case, since A and B are relatively large (B = O(101) in both cases; data for not shown), small values of λ1 can make a significant difference to the concentration profile.

