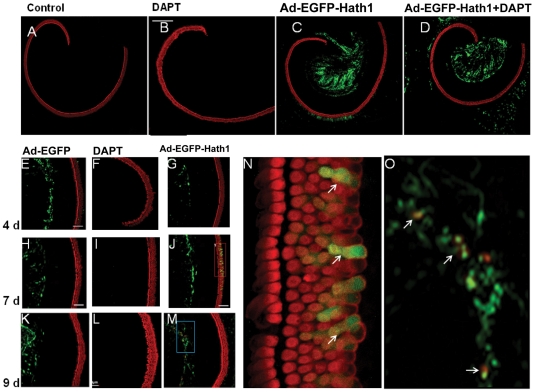
Figure 1. The overexpression of EGFP and Atoh1 in the Organ of Corti.
A–D: Cultured Organ of Corti whole mounted on the bottom of the Petri dish in vitro. A: Control sample without treatment. B: With DAPT treatment. C: With ad-EGFP-Atoh1 overexpression. D: With ad-EGFP-Atoh1 overexpression and DAPT treatment. E–M: parts of the cultured basilar membrane for 4–9 days. E, H, K: Cultured basilar membranes transfected with adenovirus that carrying EGFP gene for 4, 7, and 9 days, indicating the expression of EGFP in the region of great epithelia ridge (GER). F, I, L: Cultured basilar membranes treated with DAPT for 4, 7, and 9 days. G, J, N: Cultured basilar membranes transfected with adenovirus that carrying EGFP and Atoh1 gene for 4, 7, and 9 days. N, Enlarged picture in the red Frame in panel J. white arrows indicating the extra hair cells express Myosin VIIa and EGFP in the Organ of Corti. O: Enlarged picture in the blue Frame in panel M (indicating the cells express Myosin VIIa and EGFP in GER region (white arrows). Green channel: EGFP expression. Red channel: Myosin VIIa expression.

