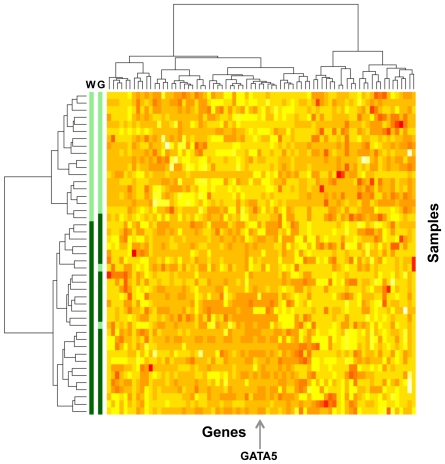
Figure 1. Unsupervised cluster analysis of DNA methylation markers and gastroesophageal adenocarcinimas.
Heat map of the standardized (log-transformed percent of methylated reference (PMR) values) DNA methylation values for 74 genes (columns) in 45 gastroesophageal tumor samples (rows) from 44 patients. The clustering was performed using the Ward method. Similar methylation patterns were clustered closely, and two major sample groups were formed based on the DNA methylation profiles of these 74 genes. Based on the Ward method (W, left color bar), the lower 27 samples/27 patients (dark green) were assigned to Group 1, and the upper 18 samples/17 patients (light green) were assigned to Group 2. Based on GATA5 DNA methylation criterion (G, right color bar), 26 samples/26 patients (dark green) belonged to Group 1, and 19 samples/18 patients (light green) belonged to Group 2. The arrow at the bottom of the diagram shows the GATA5 DNA methylation column. Red color in the diagram represents high-standardized DNA methylation values. Yellow color in the diagram represents low-standardized DNA methylation values.

