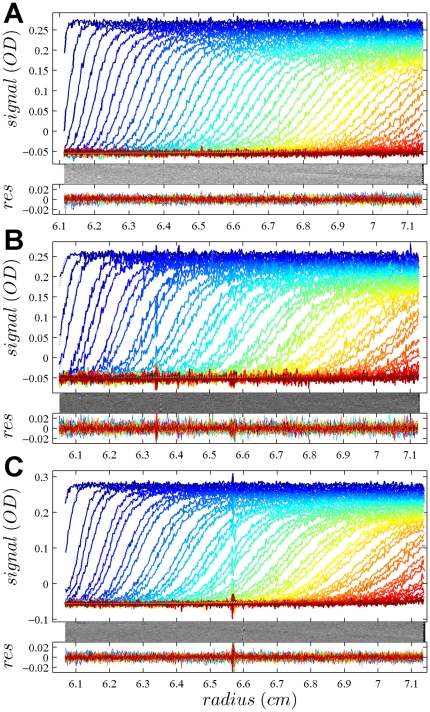
Figure 1. Global density variation SV analysis of the phosphorylase B sample recorded with the absorbance data at 280 nm.
The sets of panels present the data in (A) H2O, (B) 50% H2 18O, and (C) 90% H2 18O based buffer. For each set of panels, the measured data (corrected for the time-invariant noise contributions) are shown as solid lines, and the global best-fit profiles are shown as thin dotted lines (virtually superimposed to the data). Higher color temperatures indicate later times. Below are the residuals bitmap (a 2d grey-scale representation of residual values with time plotted vertically and radius horizontally [69]) and the residuals of the fit, with rmsd of 0.00365 OD (A), 0.00411 OD (B), and 0.00380 (C). In the presence of H2 18O, fewer scans were included into the analysis in order to achieve similar numbers of total scans representing the sedimentation process. The best-fit c(s) distribution from this analysis is shown in Figure 2.

