This is an open-access article, free of all copyright, and may be freely reproduced, distributed, transmitted, modified, built upon, or otherwise used by anyone for any lawful purpose. The work is made available under the Creative Commons CC0 public domain dedication.
This is an open-access article distributed under the terms of the Creative Commons Public Domain declaration, which stipulates that, once placed in the public domain, this work may be freely reproduced, distributed, transmitted, modified, built upon, or otherwise used by anyone for any lawful purpose.
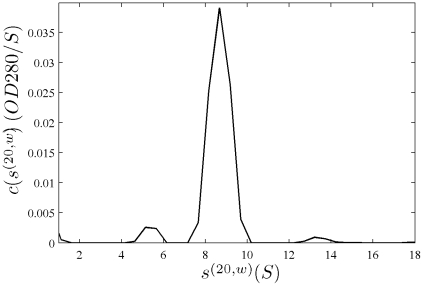
 and
and  were 1.039 and 1.136 (see Eq. 19), indicating slightly different best-fit loading concentrations.
