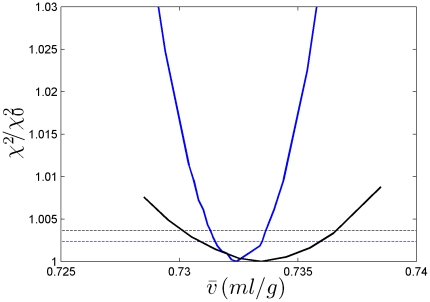
Figure 9. Projections of the error surface as a function of .
 -values. Shown are the relative increase in the χ2 of the fit as a function of different fixed
  -values, for each value freely adjusting all other unknown parameters [79]. Data are shown for the absorbance IgG data set (black) and the interference data set from the BSA sample (blue). For each, the dashed line shows the increase predicted by F-statistics for the 68% confidence level [79]. This critical increase of χ2 is lower for the BSA data set due to the significantly larger number of data points.

