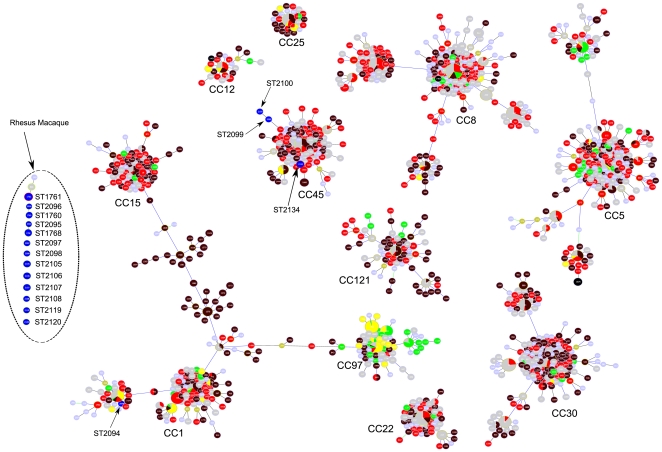
Figure 2. Partial population snapshot of S. aureus.
This snapshot was created by goeBURST v1.2 software using the dataset downloaded from http://saureus.mlst.net/ that included 2010 STs representing 3887 isolates. A subset of this dataset (1304 STs, representing 2875 isolates) is presentend in this figure including all major Clonal Complexes (CCs) supplemented with all rhesus macaque ST as far as they were not part of the major CCs. The area of each circle in the goeBURST diagram corresponds to the relative abundance of the STs in the input data. The names of major CCs have been indicated. ST colors refer to the source S. aureus was isolated from. STs representing macaque isolates are indicated in blue and by their ST number; brown colors correspond with community-acquired human isolates; red colors correspond with hospital-acquired human isolates; green colors correspond with animal isolates; yellow colors correspond with S. aureus isolates from food; grey, light green, and light blue colors correspond with isolates with unknown source.

