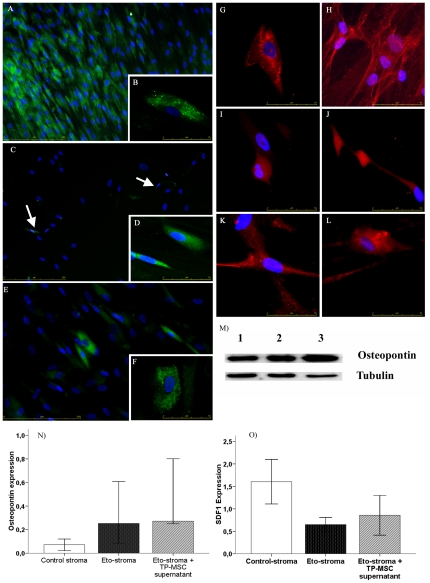
Figure 2. SDF-1α and osteopontin in vitro expression by MSC.
A) SDF-1 expression in control stromas: positive cluster (on the left) surrounded by negative cells (right) showing a polygonal shape (B). C) In etoposide-treated stromas SDF-1 expression was weaker and cells had different shapes (D). E) In treated stromas cultured with TP-MSC supernatant, there was an increase in the number of positive cells, which were polygon-shaped (F). Regarding osteopontin, in control stromas it was expressed in polygonal cells (G, H). In etoposide-treated stromas, osteopontin expression was stronger than in controls and was located in unusually shaped cells in standard culture medium (I, J) and it was also high expressed in treated-stromas cultured with TP-MSC supernatant (K, L). M) As confirmed by western blot, osteopontin expression was lower in untreated stromas than in etoposide-treated stromas (1 = Control; 2 = Etoposide-treated; 3 = Etoposide-treated+TP-MSC supernatant). Finally, the expression of both molecules osteopontin (N) and SDF-1 (O) was confirmed by PCR.

