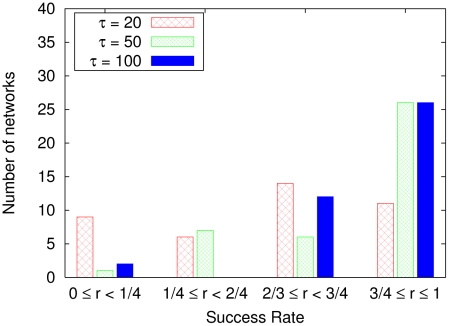
Figure 3. Success rate  of a robot controlled by a neural network to move an object.
For example,  indicates
  success of moving the object without dropping it. The graph depicts the frequencies of networks occurring in certain ranges of the success rate. We recorded the behaviors of the robot for up to
  trials of moving the object for
  sample networks. The average success rates for the higher-level time constant
  of
of  ,
,  , and
, and  were
were  ,
,  , and
, and  , respectively.

