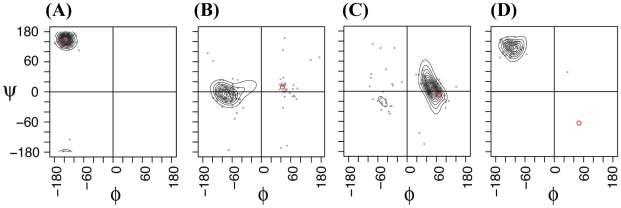
Figure 2. Density estimations of φ,ψ distributions.
Examples of DPM-HMM estimated backbone dihedral angle density distributions at various positions of targets from predictions of the CDRH2 loop and anchor residues. The grey dots represent the observed φ,ψ input data at a particular alignment position. The contour lines represent the calculated density estimation calculated from the φ,ψ pair data. The red dots indicate the actual φ,ψ values of the target structure. Position refers to the place in the modeled loop and the PDB code refers to the predicted target. (a) position 1 of 1mfa [55], (b) position 6 of 1w72 [56], (c) position of 6 for 1gig [57] and (d) position 9 (last anchor residue) of 1rmf [58].

