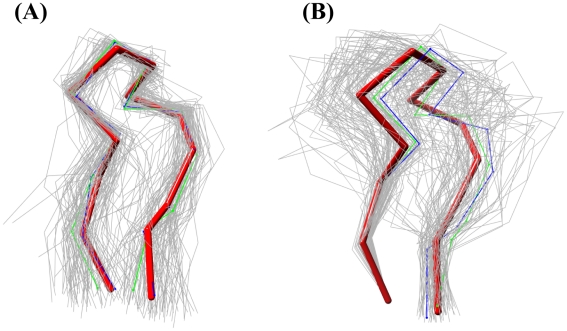
Figure 3. Local versus global superposition.
The 97 candidate loops below 1 Å average Cα–Cα termini distance cutoff for the target loop 3bpx from dataset T0617, showing various orientations of the candidate loops (grey) in backbone Cα trace. Reference loop is shown in red stick representation. The best candidate by local superposition in blue and best candidate by global superposition is shown as green. (a) Local superposition of candidate loops to the reference crystal structure with average local RMSD of 1.86 Å. (b) Candidate loops are superposed only at the take-off region (first residue at N-terminus) of the loop. Average global RMSD of candidates to the reference crystal structure is 3.17 Å.

