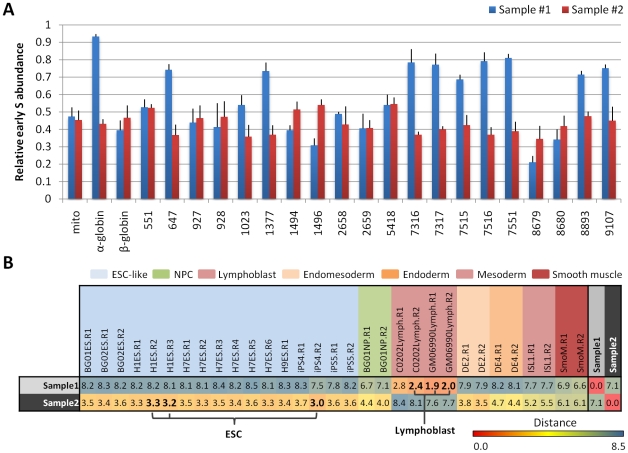
Figure 6. Independent verification of fingerprint classification by PCR.
A. NC-NC lymphoblasts and WIBR3 hESCs were BrdU labeled, early and late nascent strands were purified as for all other cells, and nascent strands were analyzed blindly by PCR using primers specific to 20 human fingerprint regions and control regions (mito: mitochondrial DNA, α-globin, β-globin). Replication times are represented by the relative abundance of each sequence in early S phase as a fraction of its abundance in both early and late S. Error bars depict the average and SEM for each locus after 6 replicate experiments. B. Euclidean distances between replication profiles measured in fingerprint regions described in Table 1, after rescaling PCR values to array scale. Color scale for numbers relates the relative similarity of cell types in fingerprint regions, from highly similar (red) to highly divergent (blue). The three lowest distances used for kNN classification (k = 3) are highlighted in bold font, with unknown samples #1 and #2 correctly designated as lymphoblasts and ESCs, respectively using the three shortest distances.

